Thursday, November 19, 2020

IELTS Book 1 Test 3 Writing Task 1

The chart below shows the amount of money per week spent on fast foods in Britain. The graph shows the trends in consumption of fast foods. Write a report for a university lecturer describing the information shown below.

Money spent on fast food per week in Britain

Consumption of fast food in Britain per person (in gram).

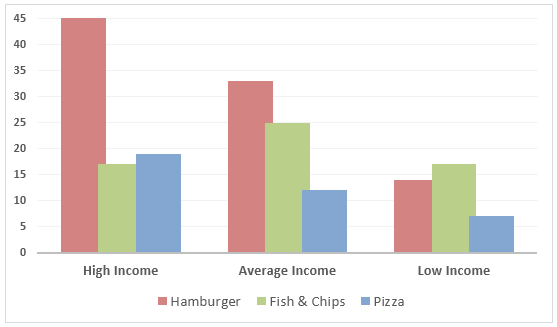
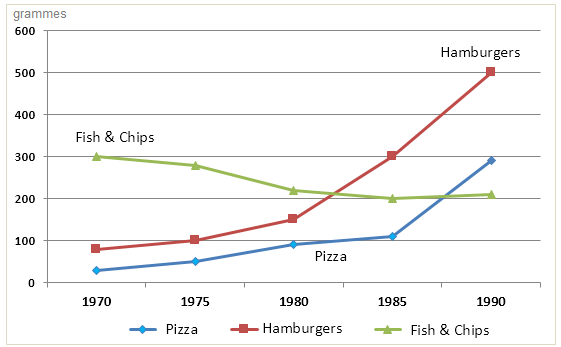
The column graph shows how much money the British citizens spent on three fast food items based on their economic status in 1990 while the line graph reveals the consumption of these items during 1970 and 1990. Overall, rich British spent more on junk food than low-income class in 1990 and fish & chips became the most consumed junk food over the period.

It is interesting to note that, wealthy British spent more on hamburgers while less on fish & chips. They drained around 45 pence per person in a week for hamburgers while roughly 15-20 pence on other two items. Moderate income class prefered hamburger but spend approximately 33 pence on that. They spent the least on the pizza which amounted for nearly 12 pence. Low-income class, on the contrary, spent less on fast foods and they spent between 7 to 14 pence for each item, despite fish and chips being their most favourite.

According to the line graph, British citizens consumed pizza more than other two items. In 1970, consumption of pizza was 300 gm per person while it was less than 100 gm for other two items. Over the time, fish & chips became the most consumed fast food with 500 gm consumption. During this time, pizza became less popular while hamburger gained some popularity. 

IELTS Book 1 Test 2 Writing Task 1

The diagram below shows how the Australian Bureau of Meteorology collects up-to-the-minute information on the weather in order to produce reliable forecasts. Write a report for a university lecturer describing the information shown below.

Writing task 1 - How Australia collects information on weather

The given diagram shows how the weather information is collected by Australian Bureau of Meteorology to provide accurate and updated weather forecasting. As is observed from the given illustration, the weather information collection is done via satellites, radars and drifting buoys and then analysed before broadcasting them to the public.

As is presented in the diagram, the weather information is collected using three different types of sources namely, satellites, radars and drifting buoys. The raw data collected from satellites is basically satellite photos while radar information is observed from the radar screens and the synoptic charts are yielded from the drifting buoys and these three types of data are fed into a computer system to analyse and prepare the weather news for broadcasting.
      
After that, the weather, the news is broadcasted in different public media like televisions, radios and telephones. The final information regarding the weather is provided to the public via TV news, radio broadcasting and as a recorded announcement in devices like telephones.

IELTS Book 1 Test 1 Writing Task 1

The charts below show the result of a survey of adult education. The first chart shows the reason why adults decide to study. The pie chart shows how people think the costs of adult education should be shared. Write a report for a university lecturer, describing the information shown below.

Reasons why adults decide to study - Bar graph

How the costs of each course should be shared - Pie Chart 

The figures illustrate the result of an opinion survey about the reason why adult people choose to study and how tuition costs should be funded. It is clear that based on the survey result, the two main reasons why adults have continued their study are due to they are interested in subjects and to obtain the degree. It is also noticed that the survey also shows that most of the education cost should be funded by individuals themselves. 

It can be seen that the two main purposes why adult continue their study are because they interested with the program and to obtain the qualification, as these two reasons result reached 40% and 38% respectively. Meanwhile, the percentages of the survey for reasons of helpful for their current job, improving prospect and promotion, and that they like studying were in the range between 22% and 20%. As for figures of those who study for the purpose of changing jobs and to meet new people, they were below 15% each. 

As for the survey result of the education cost, it is obvious that 40% of the cost should become the burden of the respective person themselves. Then 35% should be provided by the employer and 25% from the taxpayer.