The charts below show the result of a survey of adult education. The first chart shows the reason why adults decide to study. The pie chart shows how people think the costs of adult education should be shared. Write a report for a university lecturer, describing the information shown below.
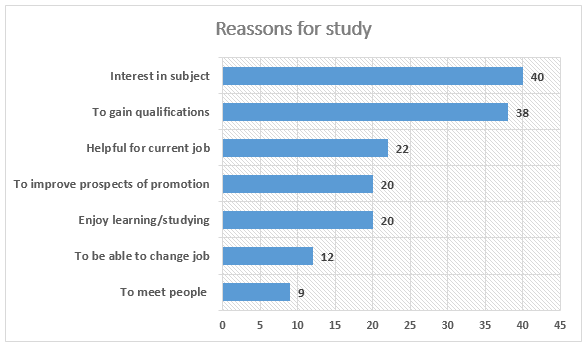
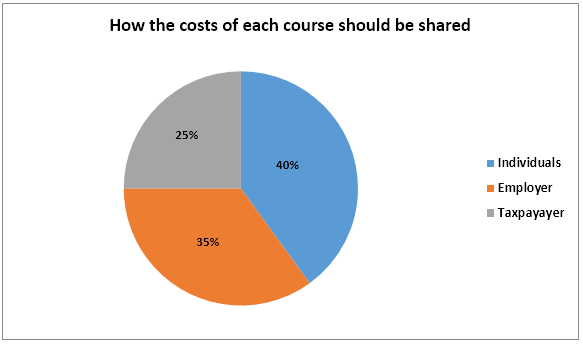
The figures illustrate the result of an opinion survey about the reason why adult people choose to study and how tuition costs should be funded. It is clear that based on the survey result, the two main reasons why adults have continued their study are due to they are interested in subjects and to obtain the degree. It is also noticed that the survey also shows that most of the education cost should be funded by individuals themselves.
It can be seen that the two main purposes why adult continue their study are because they interested with the program and to obtain the qualification, as these two reasons result reached 40% and 38% respectively. Meanwhile, the percentages of the survey for reasons of helpful for their current job, improving prospect and promotion, and that they like studying were in the range between 22% and 20%. As for figures of those who study for the purpose of changing jobs and to meet new people, they were below 15% each.
As for the survey result of the education cost, it is obvious that 40% of the cost should become the burden of the respective person themselves. Then 35% should be provided by the employer and 25% from the taxpayer.
No comments:
Post a Comment