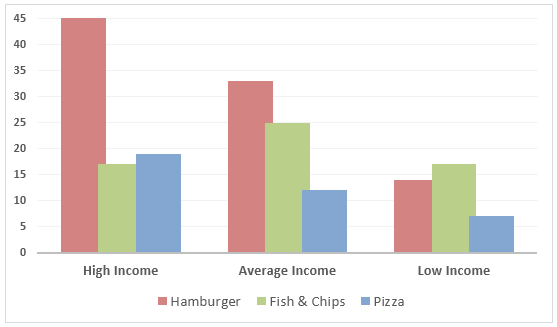
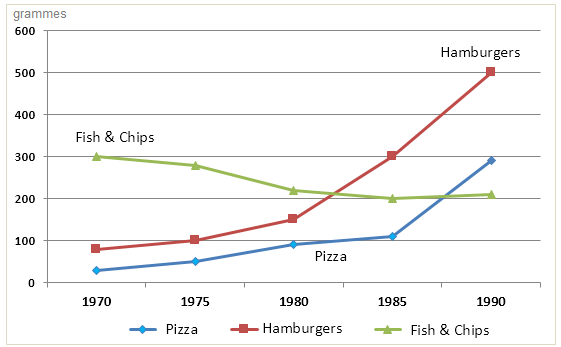
The chart below shows the amount of money per week spent on fast foods in Britain. The graph shows the trends in consumption of fast foods. Write a report for a university lecturer describing the information shown below.


The column graph shows how much money the British citizens spent on three fast food items based on their economic status in 1990 while the line graph reveals the consumption of these items during 1970 and 1990. Overall, rich British spent more on junk food than low-income class in 1990 and fish & chips became the most consumed junk food over the period.
It is interesting to note that, wealthy British spent more on hamburgers while less on fish & chips. They drained around 45 pence per person in a week for hamburgers while roughly 15-20 pence on other two items. Moderate income class prefered hamburger but spend approximately 33 pence on that. They spent the least on the pizza which amounted for nearly 12 pence. Low-income class, on the contrary, spent less on fast foods and they spent between 7 to 14 pence for each item, despite fish and chips being their most favourite.
According to the line graph, British citizens consumed pizza more than other two items. In 1970, consumption of pizza was 300 gm per person while it was less than 100 gm for other two items. Over the time, fish & chips became the most consumed fast food with 500 gm consumption. During this time, pizza became less popular while hamburger gained some popularity.
No comments:
Post a Comment