The first chart below shows the results of a survey which sampled a cross-section of 100,000 people asking if they traveled abroad and why they traveled for the period 1994-98. The second chart shows their destinations over the same period. Write a report for a university lecturer describing the information shown below.
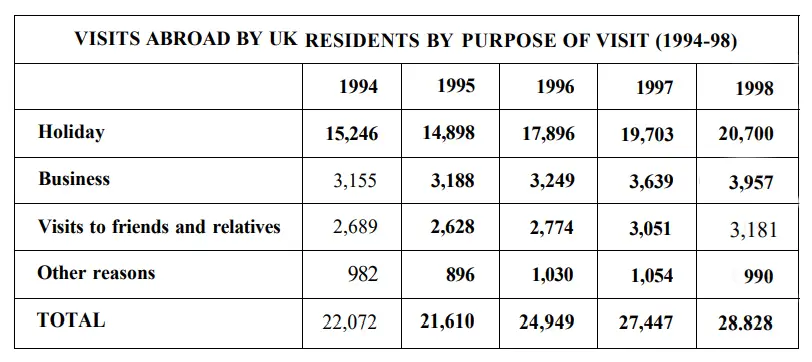
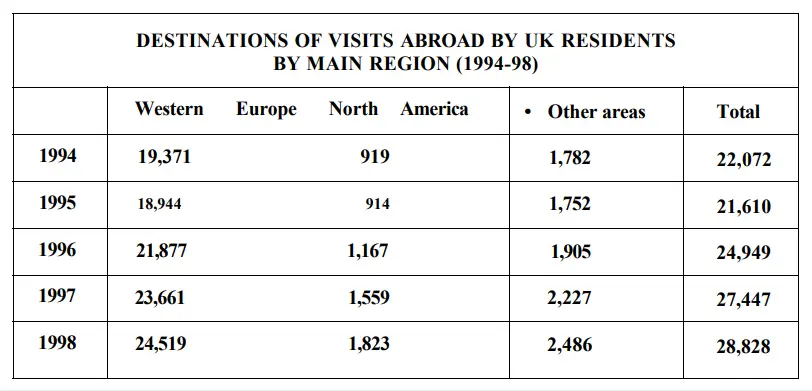
The provided charts show the data of a survey conducted on 100,000 people and the statistics shows the number of UK citizen travelled abroad from 1994 to 1998 for different purposes and their destinations. As is observed from the given graphs, most of the UK residents travelled on their holidays and Western Europe was their most favourite destination.
Initially, in 1994, more than 22 thousand UK resident travelled to different foreign countries and among them, more than 15 thousand went on their holidays. For business tours, more than 3 thousand people travelled in other countries in the same year while more than 2 thousand people visited their friends and relatives. After 1 year, this number slightly decreased and for the rest of the years until 1998, the number steadily increased in almost all of the categories. Finally, in 1998, the total traveller number reached more than 28 thousand and among them, more than twenty thousand people travelled to enjoy their holidays.
In 1994, almost 18 thousand people out of 22 thousand went to Western Europe which is significantly larger than the number of people travelled to North America and other parts of the world. The similar trends can be observed for the remaining years and the majority people of the UK went to Western Europe which makes this place the most popular tourist’s destination of UK people.
No comments:
Post a Comment