Thursday, November 19, 2020

IELTS Book 3 Test 1 Writing Task 1


The charts below show the number of Japanese tourists traveling abroad between 1985 and 1995 and Australia's share of the Japanese tourist market. Write a report for a university lecturer describing the information shown below.

Japanese tourists traveling abroad between 1985 and 1995

Australia's share of the Japanese tourist market

The bar chart outlines how many Japanese travelled overseas between 1985 and 1995 while the line graph delineates the percentages of these tourists who visited Australia in particular between 1985 and 1994. Overall, the number of Japanese who made overseas travels soared and this is also true for the Australia visiting travelers from Japan.

As can be seen from the illustration, around 5 million Japanese citizens travelled different countries in 1985 which kept on increasing each year except in 1991. From approximately 7 million tourists in 1987, it went as high as 12 million in just 6 years. Finally, in 1995, around 15 million Japanese toured foreign countries which was three times higher than that of a decade earlier.

The line graph shows that 2% Japanese tourists reached Australia in 1985 and with a steady increase this figure went as high as roughly 5% in 1988. The next year the ratio slightly dipped but went higher each year in the subsequent years. Australia received more than 6% Japanese travellers in 1993, the highest, which stood at exactly 6% in 1994. 

IELTS Book 2 Test 4 Writing Task 1

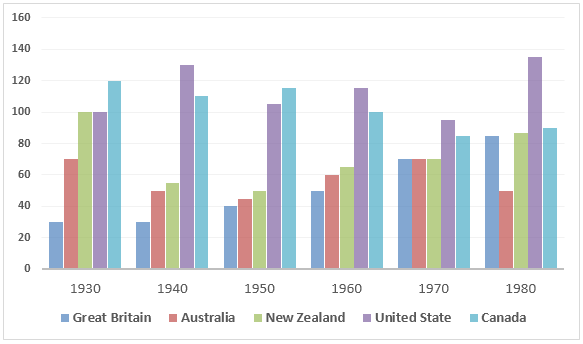
The table below shows the figures (in thousand) for imprisonment in five countries between 1930 and 1980. Write a report for a university, lecturer describing the information shown below.
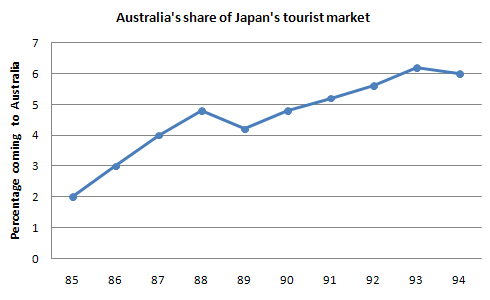
Table - the figures for imprisonment in five countries

The bar chart depicts the number of prisoners in thousands, in five different countries, namely Great Britain, Australia, New Zealand, United States and Canada during a period of 50 years commencing from 1930. Overall, the graph gives an impression that, imprisonment rate in the USA and UK escalated over the time while in Canada, Australia, New Zealand, it actually decreased.

As is evident in the presentation, Great Britain had the lowest number of imprisonment throughout the initial 40 years till 1980. Interestingly, Britain had witnessed a steady growth in figures, which started from around 30000 in the year 1930 and reached around 70000 in the year 1970. By contrast, the United States had the maximum number of criminals throughout the entire span of years except in the first decade, which is 1930. Moreover, in the year 1980, United States had to imprison the highest number of citizens in the entire period, which accounted for around 130000.

It is apparent from the graph that the crime rate in Canada had fallen gradually and steadily, from 120000 people in 1930 to a significantly less 90000 people in 1980. However, except for the years, 1930 and 1980, Australia had considerably less number of jailing and the New Zealand had always positioned as top three consistently just behind Canada and the United States.

IELTS Book 2 Test 3 Writing Task 1

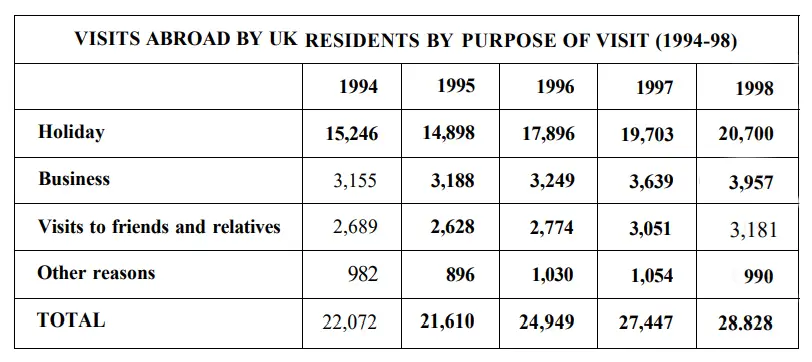
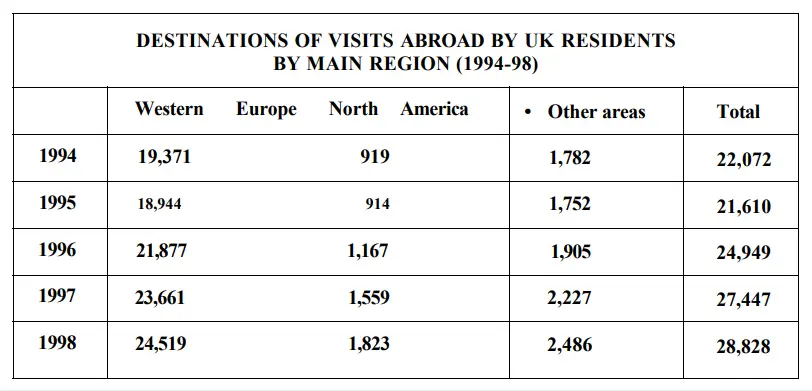
The first chart below shows the results of a survey which sampled a cross-section of 100,000 people asking if they traveled abroad and why they traveled for the period 1994-98. The second chart shows their destinations over the same period. Write a report for a university lecturer describing the information shown below.

The provided charts show the data of a survey conducted on 100,000 people and the statistics shows the number of UK citizen travelled abroad from 1994 to 1998 for different purposes and their destinations. As is observed from the given graphs, most of the UK residents travelled on their holidays and Western Europe was their most favourite destination.

Initially, in 1994, more than 22 thousand UK resident travelled to different foreign countries and among them, more than 15 thousand went on their holidays. For business tours, more than 3 thousand people travelled in other countries in the same year while more than 2 thousand people visited their friends and relatives. After 1 year, this number slightly decreased and for the rest of the years until 1998, the number steadily increased in almost all of the categories. Finally, in 1998, the total traveller number reached more than 28 thousand and among them, more than twenty thousand people travelled to enjoy their holidays.

In 1994, almost 18 thousand people out of 22 thousand went to Western Europe which is significantly larger than the number of people travelled to North America and other parts of the world. The similar trends can be observed for the remaining years and the majority people of the UK went to Western Europe which makes this place the most popular tourist’s destination of UK people.